
For most sites, three tools cover the essentials: Google PageSpeed Insights for ranking signals and Core Web Vitals thresholds, GTmetrix or WebPageTest for file-level waterfall diagnostics, and a real-user monitoring service like DebugBear or Matomo for ongoing 75th-percentile tracking. If you'd rather skip the tool stack entirely, Thewebteam offers a fully managed WordPress performance and maintenance service so you never have to run these audits yourself.
Quick picks by job:
- Ranking and CWV signals: Google PageSpeed Insights, Google Search Console
- Developer root-cause diagnostics: GTmetrix, WebPageTest, Lighthouse
- Real-user monitoring (RUM): DebugBear, Matomo, Google Analytics 4
- UX and heatmaps: Microsoft Clarity (free), Hotjar, Crazy Egg
- A/B testing and CRO: Optimizely, VWO, AB Tasty, Unbounce
- Accessibility and QA: WAVE, accessScan by accessiBe, BrowserStack
- Managed, hands-off option: Thewebteam — fast WordPress builds, one-year free hosting, ongoing monitoring
Target outcomes: LCP at or below 2.5 seconds, INP at or below 200ms, and CLS below 0.1 — the thresholds Google uses to classify a URL as "Good."
Table of Contents
- How these tools compare at a glance
- The best website performance optimization tools, reviewed by category
- What each tool category actually does and when to use it
- How to choose the right tools for your website
- The practical workflow: PSI + GTmetrix/WebPageTest + RUM
- Support and community resources
- Real-world impact: what these tools have surfaced
- Key Takeaways
- Why most small businesses are better off with less tool complexity
- Thewebteam handles performance so you can focus on your business
- FAQ
- Sources and further reading
How these tools compare at a glance
| Tool / Category | Best for | Primary function | Pricing | CWV / field data | RUM vs synthetic | Audience | Monitoring & alerts |
|---|---|---|---|---|---|---|---|
| Thewebteam | Managed WP performance | Managed builds + care plans | Fixed-fee / retainer | Via PSI integration | Managed monitoring | Business owner | Ongoing, proactive |
| Google PageSpeed Insights | SEO / ranking baselines | CWV + Lighthouse audit | Free | CrUX field data ? | Both | Marketer + dev | On-demand |
| Google Search Console | CWV issue tracking | Field data + URL reports | Free | CrUX field data ? | Field | Marketer | Alerts on regressions |
| Lighthouse | Dev audits in CI/CD | Lab audit + scoring | Free | Lab only | Synthetic | Developer | CI/CD integration |
| GTmetrix | Waterfall diagnostics | Synthetic waterfall | Free / ~$5/mo+ | Lab only | Synthetic | Developer | Scheduled tests |
| WebPageTest | Deep forensic testing | Multi-step waterfall + filmstrip | Free / Pro plans | Lab only | Synthetic | Developer | Scheduled + API |
| DebugBear | CWV monitoring | Lab + RUM + CrUX | Paid | CrUX + RUM ? | Both | Developer | Continuous alerts |
| Matomo | Privacy-first RUM | Analytics + RUM | Free (self-host) / Cloud | RUM ? | Field | Marketer + dev | Configurable |
| Google Analytics 4 | Conversion + behavior | Analytics + basic perf | Free | Partial RUM | Field | Marketer | Limited |
| Microsoft Clarity | UX / CLS diagnosis | Heatmaps + session replay | Free | — | — | Marketer | — |
| Hotjar / Crazy Egg / FullStory | UX behavior analysis | Heatmaps + session replay | Free tier / paid | — | — | Marketer | — |
| Pingdom | Uptime monitoring | Uptime + basic speed | Paid (~$10/mo+) | — | Synthetic | Marketer | Uptime alerts |
| Ahrefs / Semrush / Moz | SEO audits | Technical SEO + site audit | Paid | Partial (via PSI) | Synthetic | Marketer | Crawl alerts |
| Screaming Frog / Dynomapper | Technical crawl | Site crawl + link audit | Free / Paid | — | Synthetic | Developer | Scheduled crawls |
| Optimizely / VWO / AB Tasty | A/B testing + CRO | Experimentation | Paid (varies) | — | — | Growth team | — |
| Unbounce | Landing page CRO | Page builder + A/B | Paid | — | — | Marketer | — |
| WAVE / accessScan | Accessibility QA | Accessibility audit | Free / paid | — | Synthetic | Developer | — |
| WP Rocket / Autoptimize / RocketCDN | WordPress optimization | Caching + asset delivery | Paid | Improves lab scores | Synthetic | WP owner | — |
| Rank Math / Surfer SEO | On-page SEO | SEO optimization | Free / paid | Partial | — | Marketer | — |
| Imagify / Optimole / Online Convert | Image optimization | Image compression | Free tier / paid | Improves LCP | — | WP owner | — |
| Contentsquare | Enterprise UX analytics | Journey analytics + heatmaps | Enterprise pricing | — | — | Enterprise | — |
| BrowserStack | Cross-browser QA | Device + browser testing | Paid | — | Synthetic | Developer | — |
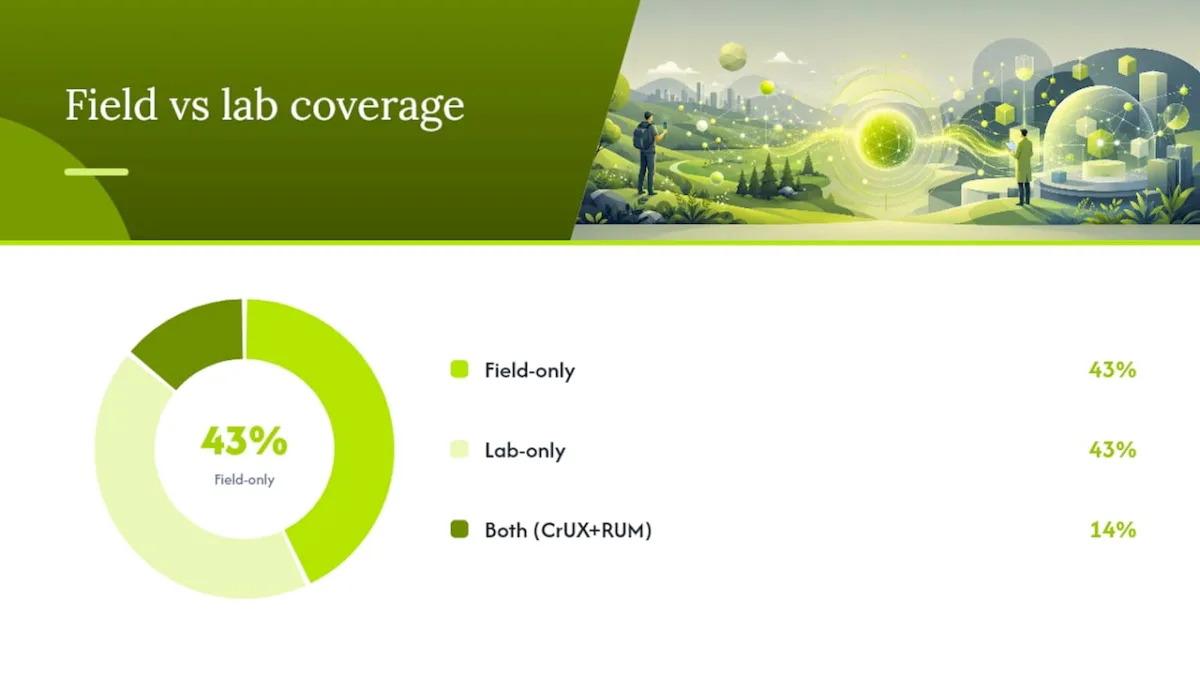
How to read this table: CWV field data means the tool surfaces real-user Chrome UX Report (CrUX) data, not just lab scores. For monitoring, prioritize tools that track the 75th percentile of user experiences across mobile — that is the threshold Google uses to classify a URL's CWV status.
The best website performance optimization tools, reviewed by category
Managed performance service
Thewebteam handles WordPress builds, hosting, and ongoing performance maintenance as a fixed-fee or retainer service. For small businesses and B2B companies without in-house developers, this removes the entire tool stack question. Thewebteam uses AI-assisted builds to launch sites in days, includes one year of free hosting, and monitors for regressions caused by plugin updates or new third-party scripts. If you want fast time-to-market and no performance debt accumulating quietly in the background, this is the practical alternative to assembling your own tool chain.
Core Web Vitals and ranking tools
Google PageSpeed Insights is the authoritative starting point for any site owner focused on search rankings. It combines Lighthouse lab data with CrUX field data, showing real-user LCP, INP, and CLS values alongside estimated fix savings. Free, no account required, and the closest proxy for how Google actually sees your pages.
Google Search Console surfaces CWV issues at scale across your entire URL set, grouped by status (Good, Needs Improvement, Poor). It alerts you to regressions and lets you validate fixes after deployment. Pair it with PSI for page-level detail.
Lighthouse runs inside Chrome DevTools or as a CLI/CI tool. It produces the same lab audit PSI uses, but you control the test environment. Useful for catching regressions in a build pipeline before they reach production.
DebugBear goes further by combining CrUX field data, lab metrics, and RUM in a single monitoring product. It sends alerts when CWV scores drop and provides actionable fix recommendations. The paid entry point is higher than most tools here, but it is the most complete single-product solution for teams that want continuous CWV coverage without stitching together three separate services.
Synthetic waterfall and diagnostic tools
GTmetrix produces detailed waterfall charts that show exactly which resources are blocking render. Developers use it to identify oversized images, render-blocking scripts, and slow third-party calls. The free tier covers most diagnostic needs; paid plans add scheduled monitoring and more test locations.
WebPageTest is the tool performance engineers reach for when GTmetrix isn't deep enough. It supports multi-step user flows, filmstrip views, connection throttling, and custom scripting. Understanding what the waterfall reveals requires familiarity with the critical rendering path and the Navigation Timing API, but the payoff is root-cause precision that no other free tool matches.
Analytics and real-user monitoring
Google Analytics 4 captures behavioral data and some performance signals, but it is not a dedicated RUM tool. Use it for conversion tracking and session analysis alongside a purpose-built RUM service.
Matomo is the privacy-forward alternative. Self-hosted instances keep all data on your own servers, which matters for GDPR and CCPA compliance. It supports RUM features and gives compliance-conscious teams full control over what is collected and retained.
Kissmetrics and Woopra focus on customer journey analytics and cohort-level behavior rather than raw performance metrics. They complement RUM tools by connecting speed data to revenue outcomes.
SEO suites
Ahrefs and Semrush both include site audit modules that flag technical SEO issues, including some performance-related signals pulled via PSI. Neither replaces a dedicated CWV tool, but their crawl-based audits surface broken links, redirect chains, and crawlability problems that indirectly hurt rankings. Moz covers similar ground with its site crawl and domain authority metrics.
Rank Math and Surfer SEO operate at the on-page level. Rank Math handles WordPress SEO configuration and schema; Surfer SEO guides content optimization. Writesonic adds AI-assisted content drafting to the mix, useful for teams combining content and technical SEO work.
UX, heatmaps, and session replay
Microsoft Clarity is free with no session limits. It records clicks, scrolls, and rage clicks, and its heatmaps are useful for diagnosing CLS-related layout problems. For most small and mid-size sites, Clarity covers the UX diagnostic layer without any cost.
Hotjar adds survey and feedback widgets alongside heatmaps and session replay. Crazy Egg offers A/B testing on top of its heatmap suite. FullStory targets enterprise teams that need deep session data and product analytics. Contentsquare sits at the enterprise end, combining journey analytics, zone-based heatmaps, and revenue attribution in a single platform.
UserTesting.com, Maze, TryMyUI, and QuestionPro Research Suite shift from passive observation to active user research. They recruit participants to complete tasks on your site and provide recorded sessions with verbal feedback. Qualaroo adds on-site micro-surveys for in-the-moment user feedback.
Figma belongs in this category as a design and prototyping tool. Teams use it to test layout changes before implementing them, which can prevent CLS regressions caused by poorly planned dynamic elements.
A/B testing and CRO
Optimizely and VWO are the two most widely used full-featured experimentation platforms. Both support server-side and client-side tests, integrate with analytics tools, and include personalization features. AB Tasty is a strong mid-market option with a faster setup curve. Unbounce focuses specifically on landing pages, letting marketers build and test pages without developer involvement.
Accessibility and QA
WAVE and accessScan by accessiBe scan pages for WCAG compliance issues. Accessibility problems often cause layout instability and poor keyboard navigation, both of which affect CLS scores and user experience. BrowserStack extends QA to cross-browser and cross-device testing, catching rendering differences that synthetic single-browser tools miss.
WordPress optimization plugins and CDN
WP Rocket is the most widely used WordPress caching and optimization plugin. It handles page caching, lazy loading, CSS/JS minification, and CDN integration in one place. RocketCDN pairs with it for content delivery. Autoptimize is a free alternative focused on script and style optimization. Imagify and Optimole handle image compression and WebP conversion; Online Convert covers one-off file format conversions.
Broken Link Checker scans WordPress sites for dead links that hurt both SEO and user experience. Dynomapper and Screaming Frog handle full-site crawls at a larger scale, surfacing structural issues a plugin-level tool would miss.
Mobile-Friendly Test (Google's tool) checks whether a page renders correctly on mobile devices, a prerequisite for passing Core Web Vitals on the mobile segment Google prioritizes.
What each tool category actually does and when to use it
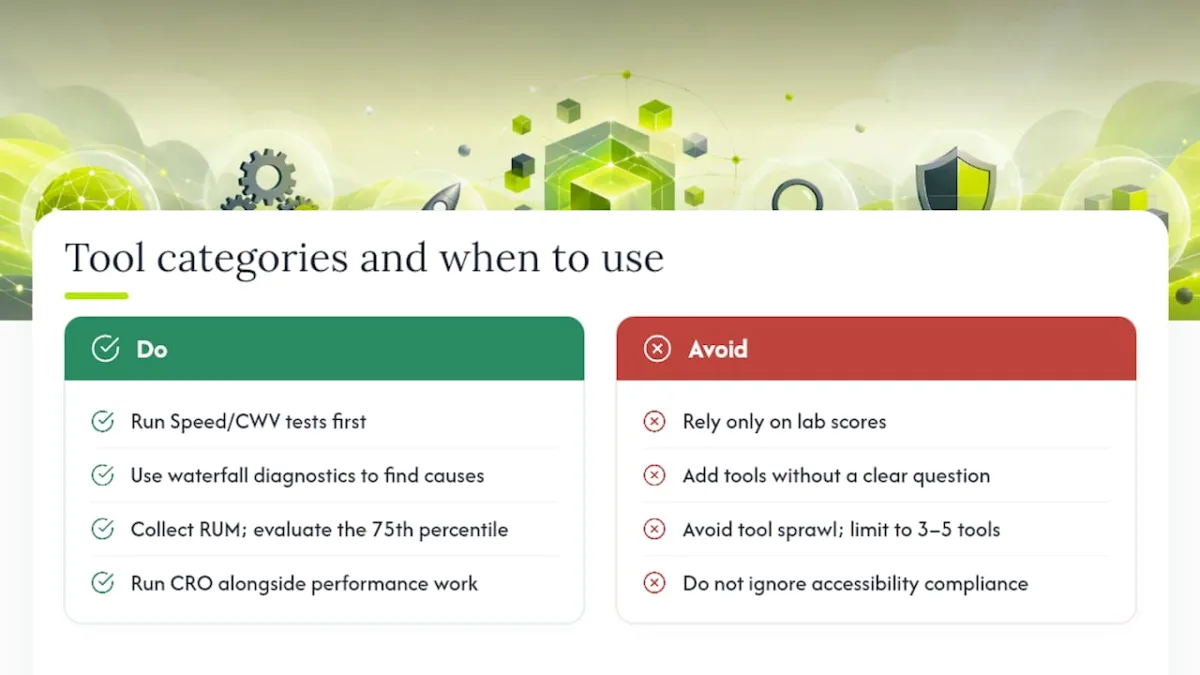
Speed and CWV testing tools (PSI, Search Console, Lighthouse) answer one question: does this page meet Google's thresholds? LCP must be at or below 2.5 seconds, INP at or below 200ms, and CLS below 0.1 to earn a "Good" classification. Use these first, before anything else.
Synthetic waterfall diagnostics (GTmetrix, WebPageTest) tell you why a page is slow. A waterfall chart shows every resource the browser fetches, in sequence, with timing for DNS lookup, connection, and download. When LCP is failing, the waterfall usually points to an unoptimized hero image, a render-blocking script, or a slow server response. The web.dev guidance on high-impact CWV fixes recommends optimizing the LCP element with preload and modern image formats, deferring render-blocking JavaScript, reserving explicit media dimensions to prevent CLS, and using a CDN to reduce TTFB.
Real-user monitoring captures what actual visitors experience across their real devices and network conditions. Lab tests reproduce issues reliably, but they cannot account for a visitor on a 4G connection in rural Montana or an older Android device. RUM tools track the 75th percentile of user experiences, which is the percentile Google uses to classify CWV status. Relying only on lab scores leads to optimizing for a test environment, not for your actual audience.
SEO suites (Ahrefs, Semrush, Moz) add crawl-based audits that catch technical issues affecting both rankings and performance. They are not substitutes for CWV tools, but they surface redirect chains, duplicate content, and crawl errors that a speed tool would never flag.
UX and heatmap tools explain behavior around slow pages. A high bounce rate on a page with a passing LCP score often means the layout shifts after load, or a key CTA is below the fold on mobile. Session replay connects the performance data to the human experience.
A/B testing and CRO tools close the loop between performance and revenue. A faster page does not automatically convert better if the copy or layout is wrong. High lab scores alone do not guarantee conversions; performance work should run alongside CRO and content optimization.
Accessibility tools catch issues that cause layout instability and exclude users. WCAG compliance is also increasingly a legal requirement for North American businesses under ADA and related standards.
Avoid tool sprawl. Three to five tools cover most sites well. Adding more tools without a clear question to answer creates noise, not insight. A marketer typically needs PSI, Clarity, and GA4. A developer adds GTmetrix or WebPageTest. A growth team adds an A/B testing platform. A compliance-conscious site adds Matomo.
How to choose the right tools for your website
Start with a short diagnostic before buying anything.
Checklist before you choose:
- What is your primary goal? (Improve rankings, reduce bounce rate, increase conversions, meet compliance requirements)
- How large is your site? (Under 50 pages vs. thousands of URLs changes which crawl tools matter)
- What is your traffic volume? (RUM tools need sufficient traffic to produce statistically meaningful percentile data)
- Do you have in-house technical capacity? (A developer can use WebPageTest; a marketer needs PSI and Clarity)
- What is your budget? (Free diagnostics cover most small sites; $10–$50/month handles basic monitoring; $100+/month buys enterprise RUM or full CRO suites)
- Do you have data privacy obligations? (GDPR and CCPA affect which analytics and RUM tools you can deploy without consent management)
Questions to ask any vendor:
- Does the tool surface field data (CrUX/RUM) or only lab scores?
- What is the data retention period, and can you export raw data?
- How frequently does monitoring run, and how fast are alerts delivered?
- Does it integrate with GA4, Google Search Console, and your CMS?
- What support is available — documentation only, or live support with an SLA?
Pricing bands to expect:
- Free: PSI, Search Console, Lighthouse, Microsoft Clarity, WAVE, Matomo (self-hosted), GTmetrix (basic), Screaming Frog (up to 500 URLs)
- $10–$50/month: Pingdom, GTmetrix Pro, basic RUM monitoring
- $50–$150/month: DebugBear, Hotjar paid tiers, WP Rocket (annual), Ahrefs/Semrush entry plans
- $150+/month: Full CRO suites (Optimizely, VWO), enterprise RUM, Contentsquare
Red flags:
- Tools that report only a single composite score with no actionable breakdown
- Client-side scripts heavier than ~50KB that increase your own TTFB or INP
- Vendor lock-in with no data export
- Platforms that push score-chasing rather than tying improvements to conversion or revenue metrics
For budget-conscious site owners, the website maintenance on a budget guide walks through cost trade-offs between DIY tools and managed services in more detail.
The practical workflow: PSI + GTmetrix/WebPageTest + RUM
Use PSI for your ranking baseline, GTmetrix or WebPageTest for file-level root-cause analysis, and a RUM service to track the 75th-percentile experience of real users over time.
Step 1: Baseline with PSI and Search Console. Run your five most important pages through PageSpeed Insights. Note the CrUX field data values for LCP, INP, and CLS. Cross-reference with Search Console's Core Web Vitals report to see which URL groups are flagged as Poor or Needs Improvement.
Step 2: Deep-dive with GTmetrix or WebPageTest. For any page failing LCP or INP, run a waterfall test. Look for the LCP element in the waterfall and check when it starts loading relative to the first byte. A late-starting LCP image usually means it is not preloaded. A long TTFB points to server response time or a missing CDN. The Navigation Timing API timestamps each phase of the request, which is what waterfall tools visualize.
Step 3: Instrument RUM and heatmaps. Deploy DebugBear, Matomo, or GA4 with performance tracking to capture real-user data. Add Microsoft Clarity for session replay. Let data accumulate for at least two weeks before drawing conclusions.
Step 4: Prioritize fixes by impact. Fix in this order: optimize the LCP element (preload + WebP/AVIF format), defer render-blocking JavaScript, reserve explicit dimensions for all images and embeds to stop CLS, and enable Brotli compression to reduce transfer size. The web.dev top CWV fixes guide covers each of these with implementation detail.
Step 5: Monitor and automate alerts. Set up scheduled tests in GTmetrix or WebPageTest. Configure DebugBear or Search Console alerts for CWV regressions. Check the 75th-percentile mobile LCP monthly at minimum.
Pro Tip: Run WebPageTest from a location close to your largest user segment, throttled to "4G Fast" mobile, and compare the filmstrip to a competitor's page. The visual comparison often reveals layout shifts and slow hero images that raw numbers obscure.
For a broader technical SEO context, the technical SEO checklist for B2B websites covers how CWV fit into a full site health audit.
Support and community resources
Google PageSpeed Insights / Search Console / Lighthouse: Backed by Google's developer documentation at developers.google.com, the web.dev blog, and an active Stack Overflow community. Official support is documentation-driven; no live chat.
GTmetrix: Detailed knowledge base and a community forum. Paid plans include email support. The GTmetrix blog publishes regular guides on interpreting waterfall results.
WebPageTest: Open-source with a public forum and GitHub repository. The Catchpoint team (which maintains WebPageTest) publishes technical deep-dives. Community support is strong among performance engineers.
DebugBear: Documentation-focused with email support on paid plans. The DebugBear blog is one of the more technically rigorous CWV resources available.
Microsoft Clarity: Microsoft's help center covers setup and feature use. No live support, but the tool is simple enough that documentation usually suffices.
Matomo: Active open-source community, a plugin marketplace, and paid cloud support plans. Self-hosted users rely heavily on the community forum and GitHub issues.
Hotjar / Crazy Egg / FullStory: All three offer live chat or email support on paid tiers. Hotjar has a particularly active user community and a well-maintained help center.
Ahrefs / Semrush / Moz: All three invest heavily in educational content. Ahrefs Academy, Semrush Academy, and Moz's Whiteboard Friday series are among the most widely used free SEO learning resources in North America.
WP Rocket: Email support with a reputation for fast response times. The knowledge base covers most common WordPress optimization scenarios.
Optimizely / VWO: Enterprise-grade support with dedicated account managers on higher tiers. Both maintain developer documentation and community forums.
Real-world impact: what these tools have surfaced
The clearest pattern across performance audits is that LCP failures almost always trace back to one of three causes: an unoptimized hero image, a render-blocking script loaded in the <head>, or a slow server response time above 600ms. GTmetrix and WebPageTest surface all three in a single waterfall view.
A common scenario for WordPress sites: a page scores 62 in PSI on mobile. The waterfall shows the hero image loading at 3.8 seconds because it is a 1.2MB JPEG with no preload hint and no WebP fallback. Adding a <link rel="preload"> tag, converting to WebP via Imagify, and enabling WP Rocket's lazy load for below-the-fold images typically brings LCP into the "Good" range. Search Console then reflects the improvement in CrUX data within 28 days as new field data accumulates.
For UX issues, Microsoft Clarity session replays frequently reveal that users on mobile are rage-clicking a button that shifts position after an ad loads. That is a CLS problem. Reserving explicit height for the ad container stops the shift, and the CLS score drops from 0.18 to <0.1 on the next PSI run.
The web.dev data shows that a meaningful share of sites fail to meet the "Good" LCP threshold, with the most common culprits being unoptimized images and render-blocking resources. Those are fixable in an afternoon with the right tools.
Accessibility audits via WAVE regularly surface missing alt text and low-contrast text that also hurt SEO. Fixing them improves both compliance and crawlability, which is why accessibility and performance QA belong in the same workflow.
Key Takeaways
The most effective approach to website performance optimization is to triangulate PSI field data, a waterfall diagnostic tool, and RUM tracking at the 75th percentile — then fix LCP, INP, and CLS in that order.
| Point | Details |
|---|---|
| Start with PSI and Search Console | These two free tools give you Google's actual CWV field data and flag which pages need attention first. |
| Use waterfalls for root-cause fixes | GTmetrix or WebPageTest pinpoints whether slow LCP comes from the image, the server, or a blocking script. |
| Track the 75th percentile in RUM | Google classifies CWV status at the 75th percentile of real users; lab scores alone will mislead you. |
| Fix in priority order | Optimize the LCP element first, then defer render-blocking JS, then reserve image dimensions to stop CLS. |
| Thewebteam as managed alternative | For businesses without in-house developers, Thewebteam handles WordPress builds, hosting, and ongoing performance monitoring as a fixed-fee service. |
Why most small businesses are better off with less tool complexity
The conventional wisdom in performance circles is that more data equals better decisions. Run PSI, GTmetrix, WebPageTest, a RUM service, a heatmap tool, an A/B testing platform, and an accessibility scanner — and you will have a complete picture. In theory, yes. In practice, most small business owners and lean marketing teams end up with five dashboards they check once a quarter and no clear owner for acting on what they find.
The tools in this guide are genuinely useful. But the value of any tool is zero if no one has the time or technical depth to act on its output. A GTmetrix waterfall is only useful if someone on your team knows what a render-blocking script looks like and how to defer it. A DebugBear alert is only useful if someone responds to it before the regression affects rankings.
The smarter question for most small businesses is not "which tools should I use?" but "who is going to act on this data?" If the honest answer is "nobody, because we're focused on running the business," then a managed service is not a shortcut. It is the correct choice. The DIY website maintenance checklist is worth reading if you want to understand what ongoing performance maintenance actually involves before deciding whether to handle it yourself.
Thewebteam handles performance so you can focus on your business
Running a full performance tool stack takes real time: baseline audits, waterfall analysis, RUM setup, monthly monitoring, and fixing regressions after every plugin update. For trades businesses, B2B companies, and niche operators, that is time better spent on clients.
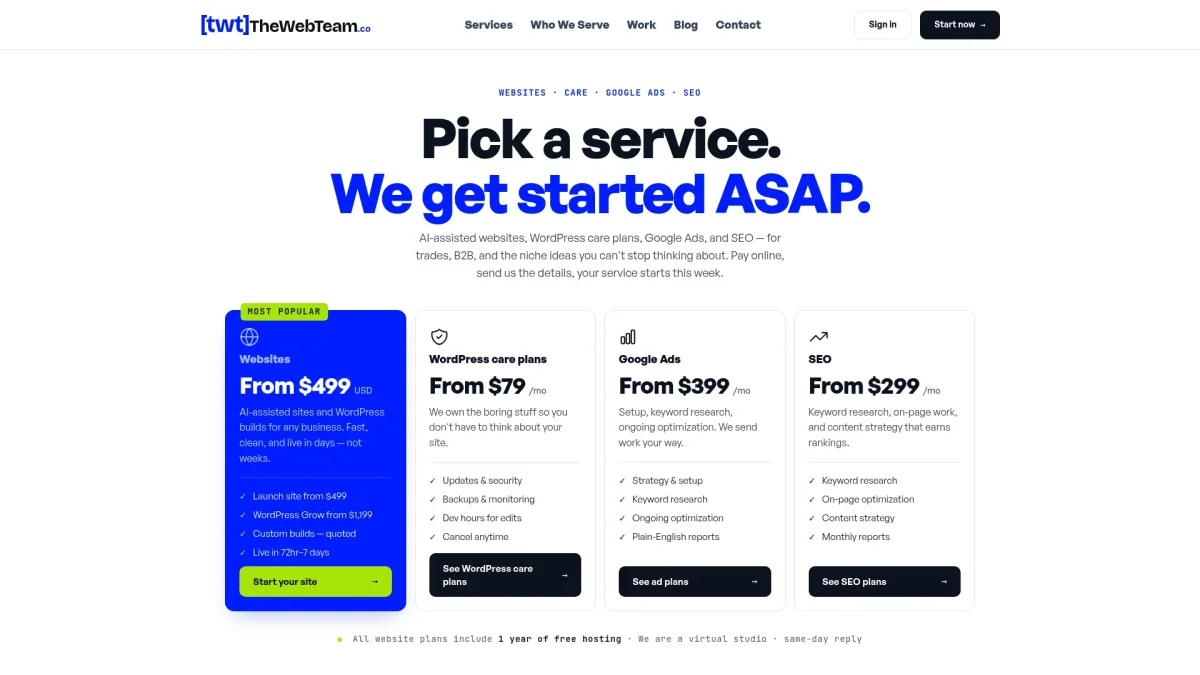
Thewebteam builds fast WordPress sites using an AI-assisted process that gets you live in days, includes one year of free hosting, and covers ongoing maintenance and performance monitoring as part of the plan. No hidden costs, no long agency retainers, and no performance debt accumulating quietly while you're busy. Check the services and pricing page to see what's included, or browse the portfolio for examples of past builds. If you serve trades, industrial, or B2B clients, the who we serve page explains exactly how Thewebteam fits your industry.